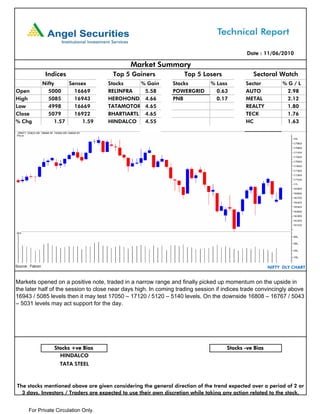
The markets opened positively and traded in a narrow range before picking up momentum later in the session to close near the day's high. Key indices like Nifty and Sensex closed up 1.57% and 1.59% respectively. Top gainers during the day included RELINFRA, HEROHONDA, and TATAMOTOR which were up over 4%. The auto, metal and realty sectors closed in the green, while the top losers were POWERGRID and PNB. In the coming sessions, if indices sustain above current resistance levels, further gains may be seen. Key stocks to watch that are positively biased include HINDALCO and TATA STEEL.
The market indices closed in the red, with the Nifty down 1.11% and Sensex down 1.09%. Metals and realty sectors saw the highest losses of around 2.5%. The market undertone remained sideways with a negative bias. Stocks like M&M, Axis Bank, HDFC Bank saw gains while Idea, Reliance Infra, and Tata Steel saw losses. The technical outlook indicates the indices need to trade above 17375/5215 levels to confirm an upside momentum. Idea Cellular is recommended for a bearish sell with a target price of Rs. 54 and stop loss of Rs. 64.
The market opened flat but closed with small gains. The daily charts show a "Hanging man" candlestick pattern, which indicates the markets may fall if support levels are broken. Top gainers were M&M, BPCL, ONGC, and Cairn, while top losers were Suzlon, Sterlite, RCom, and Siemens. Most sectors closed positive except realty. United Phosphorus is recommended as a bullish pick with a target of Rs. 230.
The market summary document provides an overview of the performance of key stock market indices and sectors in India on a given date. It summarizes that the indices opened flat but saw rising momentum over the day, closing near high levels. It also lists the top 5 gaining and losing stocks as well as the best and worst performing sectors for the day. Individual stocks are also analyzed with buy/sell recommendations given based on technical indicators.
The key points from the document are:
1. Indian stock indices Sensex and Nifty closed down over 1.4% as metals and banking sectors lost the most ground.
2. Top gainers were HCL Technologies up 2.47% and top losers were Tata Steel down 5.63%.
3. The author expects further downside in the coming session with indices likely to test support levels but a small bounce is also possible.
The market summary provides an overview of the performance of key indices and sectors in the Indian market on 14/06/2010. The Nifty closed at 5119 points, up 0.80% while the Sensex closed at 17065 points, up 0.84%. Among the top gainers were BHEL at 3.04% and Reliance at 2.93%. The top losers were Unitech at 3.68% and Bharti Airtel at 3.58%. The oil & gas sector saw gains of 1.67% while the banking sector was up 1.04%. The document maintains a positive bias for the market for the coming week as long as indices hold above 16550/4960
The document provides a market summary for April 26, 2010, including key indices levels, the top 5 gaining and losing stocks, sectoral performance, and a technical analysis indicating that the indices are finding support and further momentum is possible if resistance levels are crossed, while downside risks remain if crucial support levels are broken. Pivot levels are also provided for various stocks to identify potential support and resistance levels.
The summary provides an overview of the key information from the technical market report:
1) The indices (Nifty and Sensex) closed slightly higher, with the Nifty at 5468 and Sensex at 18217. TCS, Wipro, and HCLTech were among the top gainers, while PNB, Axis Bank, and ABB were among the top losers.
2) The report expects the indices to cross resistance levels and move higher in the coming sessions, supported by sectors like IT and tech. Downside support levels are also provided.
3) L&T is recommended as a buy above 1820 with a target of 1920 and stop loss of 1780, based on a
The market summary provides an overview of the performance of key indices and sectors in the Indian market on 09/06/2010. The Nifty and Sensex opened flat but closed in the red, down 0.93% and 0.98% respectively. Top gainers were led by Siemens at 1.70% while top losers were led by Hindalco at 5.79%. Sectoral performances were mixed with realty and metal sectors down over 2% while FMCG was up 0.69%. The document provides analysis that if indices close below support levels, further declines are possible, but a bounce is also not ruled out as hourly charts show indices in oversold zones.
The key points from the market summary document are:
1) Indian stock indices opened on a positive note and saw further gains throughout the day, closing over 1% higher.
2) Certain sectors like banking, technology and oil & gas outperformed, gaining over 1.5% each.
3) Reliance Communications, Idea Cellular, and Religare Capital Markets were among the top gainers, rising over 3%. Hero Honda was the biggest loser.
4) Technical indicators suggest the indices may continue rising if they remain above certain resistance levels in coming sessions. Key support levels are also provided.
The market indices ended the day lower, with the Nifty down 0.97% and Sensex down 0.88%. BPCL gained the most at 12.6% while ICICIBANK lost the most at 3.8%. Most sectors ended lower except for oil & gas which gained 2.88% and PSU which gained 1.13%. For the coming week, the indices are expected to trade in the range of 17000-17920 for Sensex and 5100-5366 for Nifty. Key support and resistance levels are identified. Specific stocks with positive and negative bias are also mentioned. Pivot points are provided for various stocks to watch their near term movement.
The market indices closed lower, with the Nifty down 2.28% and Sensex down 2.20%. Metals and realty sectors saw the largest losses of around 3-3%. Maruti, Sun Pharma, and Cipla were the top gainers, while JP Associates, Sterlite, and Unitech saw the largest declines of around 5%. The report notes the markets opened lower and momentum moved downward, closing near the day's lows. It expects further declines if indices close below 16540/4960 support levels. Upside bounce to 16690-16743/5013-5029 is also possible.
The market summary provides an overview of the performance of key indices and sectors in the Indian market on 30/04/2010. The Nifty closed at 5255, up 0.74% while the Sensex closed at 17503, up 0.71%. Top gainers were UNITECH (4.34%), RPOWER (4.12%), and ICICIBANK (3.11%) while top losers were POWERGRID (-4.40%), BPCL (-2.86%), and IDEA (-2.77%). Realty (1.96%) and CD (1.69%) sectors saw gains while FMCG (-0.96%) saw losses. The document provides support and resistance levels for key stocks
The document provides a market summary of key Indian stock indices and sector performances for April 20, 2010. It notes that markets opened lower due to weak global cues but recovered partially in the latter half due to gains in banking stocks. It expects continued volatility in the coming session due to an upcoming RBI policy announcement. On technical charts, the indices are in an oversold position and may see further recovery or declines depending on whether certain resistance and support levels are breached.
The document provides a daily market summary for 18/08/2010. It summarizes the performance of key indices, top gainers and losers, sectoral performance, and pivots for various stocks. The market opened flat and closed marginally lower with a narrow range formation indicating indecisiveness. Support and resistance levels are provided for the indices. Positive and negative bias stocks for the next 2-3 days are also mentioned.
The document provides a daily market summary for 18/08/2010. It summarizes the performance of key indices, top gainers and losers, sectoral performance, and technical outlook. The Nifty and Sensex closed marginally lower. Pivots and support/resistance levels are provided for various stocks. Positive and negative biased stocks for the next 2-3 days are also highlighted.
The market indices closed slightly higher, with the Nifty up 1% and Sensex up 1.02%. RCOM saw the top gains of 12.32% while Suzlon saw the largest losses of 2.07%. Most sectors closed in the green, led by telecom and autos. The markets may see further upside if indices close convincingly above previous resistance levels, but downside risks remain if key support levels are breached. Pivots are provided for various stocks to watch their trading ranges over the next 2-3 days.
The market indices opened lower due to weak global cues but closed down around 2% each. The top gainers were RCOM up 4.27% and top losers were DLF down 6.25%. Most sectors closed in the red with Metal down 3.99% and Realty down 3.89%. The document provides analysis on the market movement and support and resistance levels for various stocks.
The markets opened lower due to weak global cues and continued their downward trend throughout the day, closing near the day's lows. Key indices like Nifty and Sensex fell over 1% each. On a sectoral basis, oil & gas and metals witnessed losses of around 2% while banks and realty saw declines of 1.65% and gains of 0.55% respectively. SAIL and Hindalco were the top losers falling over 4% each while IDEA and BPCL gained around 2% each. Technical indicators on daily charts show the markets are trading in a downward channel and support levels around 17,679/5,290 could be tested if prices break below the lower trendline.
- The key Indian indices, Nifty and Sensex, opened flat but were unable to sustain gains and closed in the red.
- The top gainers were AXIS BANK, LT, and IDFC, while the biggest losers were KOTAK BANK, AMBUJACEM, and ICICIBANK.
- The market is showing a narrow range formation for the second consecutive day, indicating an absence of a clear trend direction. Support levels are seen at 17700/5300 and resistance at 17853-17900/5350-5364.
The market summary provides an overview of the performance of key indices and sectors in the Indian market on May 24, 2010. The Nifty and Sensex closed slightly lower, while certain sectors like power and realty declined over 1%. Top gainers included M&M, ITC and Gail, while top losers were NTPC, Hindalco and Hindustan Unilever. The document notes that volatility is expected around the upcoming F&O expiry and provides technical analysis on potential support and resistance levels. Pivot points are also listed for various stocks to watch their trading behavior.
The market summary provides an overview of the performance of key indices and sectors in the market on the given date. The Nifty and Sensex opened flat and traded in a narrow range before closing in the green. The top gainers were from the power, wind energy and realty sectors, while losses were seen in IT, oil & gas and auto sectors. The outlook is for further consolidation around current levels with support and resistance zones defined.
The market indices opened with gains but were unable to sustain them and closed marginally higher. The daily trend remains downward, so indices could test support levels. Reliance group stocks and power sector stocks saw gains, while banks and real estate stocks declined. Divis Labs and Power Grid were positively biased stocks while PNB and IBREALEST were negatively biased. The document provides a daily market summary including index levels, top gainers and losers, sector performances, stock recommendations and pivot table analysis.
The document provides a technical market summary for 14/09/2010. It lists the opening and closing levels of key indices like Nifty and Sensex. It also lists the top 5 gainers and losers during the day along with sectoral performances. The report notes that markets opened with a gap and momentum was seen throughout the day, driving indices to close near their highs. It provides support and resistance levels for the indices and suggests potential upside if levels are crossed. Key positive and negative stocks are also highlighted.
The key points from the document are:
1. Indian stock markets opened on a positive note and gained strength throughout the day, closing near the high of the day with the Nifty up 1.53% and Sensex up 1.6%.
2. Certain sectors like IT and metal performed well, gaining over 3% and 1.7% respectively, while top gainers included RPower, RelCapital and Infosys.
3. The document provides analysis that the indices have confirmed a bullish pattern and further upside is likely in coming days if levels of 17351/5201 are sustained. Support levels of 17063-16974/5111-5083 are also mentioned.
The markets opened lower but recovered some losses to close slightly down. Key sectors like metal and PSU saw losses while healthcare saw gains. Top gainers were Suzlon, Cipla, and Sun Pharma while top losers included ABB, Jindal Steel, and Ambuja Cement. The daily chart showed a hammer candlestick pattern indicating potential upside if indices trade above support levels in the next session. Traders were advised to exercise caution due to expected high volatility from an upcoming court verdict.
The market indices closed higher, with the Nifty up 1.74% and Sensex up 1.70%. Top gainers were RPOWER up 6.70% and TATAMOTOR up 5.70%. Top losers were POWERGRID down 1.16% and ACC down 1.10%. Most sectors closed positively, led by BANKEX up 2.55%. The market may face resistance around 16757/5030 but further rally is possible to 16843-17000/5050-5090 if it trades above these levels. Support is seen at 16507-16450/4952-4938. SUNPHARMA and JAIN IRRIGATION are suggested as stocks with positive
The key points from the market summary document are:
1. Indian stock indices Sensex and Nifty closed at higher levels of 17936 and 5368 respectively, gaining over 1% for the day.
2. Top gainers during the day were HEROHONDA, RELINFRA and BHARTIARTL while top losers were IDEA, GRASIM and TCS.
3. Realty, Oil & Gas and Auto sectors saw gains while Banking sector rose nearly 2%. The trading session is likely to see positive momentum continue if indices remain above key support levels.
The document provides a technical market summary for 01/09/2010. It summarizes the performance of key indices and sectors for the day. Nifty and Sensex opened lower but recovered losses to close marginally lower. Top gainers included M&M, Ambuja Cements, and ITC, while top losers were JP Associates, RCom, and Reliance. The document also lists pivot levels for various stocks and provides a short-term outlook suggesting the market may test resistance levels if indices trade above certain thresholds the next day.
The summary provides an overview of the key information from the technical report on the stock market:
- The indices (Nifty and Sensex) closed lower by 0.62% and 0.64% respectively. Powergrid, PNB, and ITC were among the top gainers while Suzlon, Cairn, and Cipla were the top losers.
- The report expects the indices to find support around 5380-5385 levels and sees resistance at 5480. The bullish view will only be negated if Nifty closes below 5340.
- Pivot levels are provided for various stocks to indicate support and resistance levels.
- Bajaj Hind and IDB
The document provides a market summary for the day, including:
- Index levels for Nifty and Sensex along with their opening, high, low and closing levels and percentage change
- Top 5 gainers and losers for the day along with their percentage change
- Sectoral performance for the day with percentage gain/loss for key sectors
- Analysis that markets are currently trading near the upper limit of their range and are likely to test higher levels if they close above certain index levels. Key support levels are also mentioned.
- Stocks with positive and negative bias for the next 2-3 days.
- Pivot point levels for various stocks.
The key points from the market summary document are:
1) Indian stock indices opened on a positive note and saw further gains throughout the day, closing over 1% higher.
2) Certain sectors like banking, technology and oil & gas outperformed, gaining over 1.5% each.
3) Reliance Communications, Idea Cellular, and Religare Capital Markets were among the top gainers, rising over 3%. Hero Honda was the biggest loser.
4) Technical indicators suggest the indices may continue rising if they remain above certain resistance levels in coming sessions. Key support levels are also provided.
The market indices ended the day lower, with the Nifty down 0.97% and Sensex down 0.88%. BPCL gained the most at 12.6% while ICICIBANK lost the most at 3.8%. Most sectors ended lower except for oil & gas which gained 2.88% and PSU which gained 1.13%. For the coming week, the indices are expected to trade in the range of 17000-17920 for Sensex and 5100-5366 for Nifty. Key support and resistance levels are identified. Specific stocks with positive and negative bias are also mentioned. Pivot points are provided for various stocks to watch their near term movement.
The market indices closed lower, with the Nifty down 2.28% and Sensex down 2.20%. Metals and realty sectors saw the largest losses of around 3-3%. Maruti, Sun Pharma, and Cipla were the top gainers, while JP Associates, Sterlite, and Unitech saw the largest declines of around 5%. The report notes the markets opened lower and momentum moved downward, closing near the day's lows. It expects further declines if indices close below 16540/4960 support levels. Upside bounce to 16690-16743/5013-5029 is also possible.
The market summary provides an overview of the performance of key indices and sectors in the Indian market on 30/04/2010. The Nifty closed at 5255, up 0.74% while the Sensex closed at 17503, up 0.71%. Top gainers were UNITECH (4.34%), RPOWER (4.12%), and ICICIBANK (3.11%) while top losers were POWERGRID (-4.40%), BPCL (-2.86%), and IDEA (-2.77%). Realty (1.96%) and CD (1.69%) sectors saw gains while FMCG (-0.96%) saw losses. The document provides support and resistance levels for key stocks
The document provides a market summary of key Indian stock indices and sector performances for April 20, 2010. It notes that markets opened lower due to weak global cues but recovered partially in the latter half due to gains in banking stocks. It expects continued volatility in the coming session due to an upcoming RBI policy announcement. On technical charts, the indices are in an oversold position and may see further recovery or declines depending on whether certain resistance and support levels are breached.
The document provides a daily market summary for 18/08/2010. It summarizes the performance of key indices, top gainers and losers, sectoral performance, and pivots for various stocks. The market opened flat and closed marginally lower with a narrow range formation indicating indecisiveness. Support and resistance levels are provided for the indices. Positive and negative bias stocks for the next 2-3 days are also mentioned.
The document provides a daily market summary for 18/08/2010. It summarizes the performance of key indices, top gainers and losers, sectoral performance, and technical outlook. The Nifty and Sensex closed marginally lower. Pivots and support/resistance levels are provided for various stocks. Positive and negative biased stocks for the next 2-3 days are also highlighted.
The market indices closed slightly higher, with the Nifty up 1% and Sensex up 1.02%. RCOM saw the top gains of 12.32% while Suzlon saw the largest losses of 2.07%. Most sectors closed in the green, led by telecom and autos. The markets may see further upside if indices close convincingly above previous resistance levels, but downside risks remain if key support levels are breached. Pivots are provided for various stocks to watch their trading ranges over the next 2-3 days.
The market indices opened lower due to weak global cues but closed down around 2% each. The top gainers were RCOM up 4.27% and top losers were DLF down 6.25%. Most sectors closed in the red with Metal down 3.99% and Realty down 3.89%. The document provides analysis on the market movement and support and resistance levels for various stocks.
The markets opened lower due to weak global cues and continued their downward trend throughout the day, closing near the day's lows. Key indices like Nifty and Sensex fell over 1% each. On a sectoral basis, oil & gas and metals witnessed losses of around 2% while banks and realty saw declines of 1.65% and gains of 0.55% respectively. SAIL and Hindalco were the top losers falling over 4% each while IDEA and BPCL gained around 2% each. Technical indicators on daily charts show the markets are trading in a downward channel and support levels around 17,679/5,290 could be tested if prices break below the lower trendline.
- The key Indian indices, Nifty and Sensex, opened flat but were unable to sustain gains and closed in the red.
- The top gainers were AXIS BANK, LT, and IDFC, while the biggest losers were KOTAK BANK, AMBUJACEM, and ICICIBANK.
- The market is showing a narrow range formation for the second consecutive day, indicating an absence of a clear trend direction. Support levels are seen at 17700/5300 and resistance at 17853-17900/5350-5364.
The market summary provides an overview of the performance of key indices and sectors in the Indian market on May 24, 2010. The Nifty and Sensex closed slightly lower, while certain sectors like power and realty declined over 1%. Top gainers included M&M, ITC and Gail, while top losers were NTPC, Hindalco and Hindustan Unilever. The document notes that volatility is expected around the upcoming F&O expiry and provides technical analysis on potential support and resistance levels. Pivot points are also listed for various stocks to watch their trading behavior.
The market summary provides an overview of the performance of key indices and sectors in the market on the given date. The Nifty and Sensex opened flat and traded in a narrow range before closing in the green. The top gainers were from the power, wind energy and realty sectors, while losses were seen in IT, oil & gas and auto sectors. The outlook is for further consolidation around current levels with support and resistance zones defined.
The market indices opened with gains but were unable to sustain them and closed marginally higher. The daily trend remains downward, so indices could test support levels. Reliance group stocks and power sector stocks saw gains, while banks and real estate stocks declined. Divis Labs and Power Grid were positively biased stocks while PNB and IBREALEST were negatively biased. The document provides a daily market summary including index levels, top gainers and losers, sector performances, stock recommendations and pivot table analysis.
The document provides a technical market summary for 14/09/2010. It lists the opening and closing levels of key indices like Nifty and Sensex. It also lists the top 5 gainers and losers during the day along with sectoral performances. The report notes that markets opened with a gap and momentum was seen throughout the day, driving indices to close near their highs. It provides support and resistance levels for the indices and suggests potential upside if levels are crossed. Key positive and negative stocks are also highlighted.
The key points from the document are:
1. Indian stock markets opened on a positive note and gained strength throughout the day, closing near the high of the day with the Nifty up 1.53% and Sensex up 1.6%.
2. Certain sectors like IT and metal performed well, gaining over 3% and 1.7% respectively, while top gainers included RPower, RelCapital and Infosys.
3. The document provides analysis that the indices have confirmed a bullish pattern and further upside is likely in coming days if levels of 17351/5201 are sustained. Support levels of 17063-16974/5111-5083 are also mentioned.
The markets opened lower but recovered some losses to close slightly down. Key sectors like metal and PSU saw losses while healthcare saw gains. Top gainers were Suzlon, Cipla, and Sun Pharma while top losers included ABB, Jindal Steel, and Ambuja Cement. The daily chart showed a hammer candlestick pattern indicating potential upside if indices trade above support levels in the next session. Traders were advised to exercise caution due to expected high volatility from an upcoming court verdict.
The market indices closed higher, with the Nifty up 1.74% and Sensex up 1.70%. Top gainers were RPOWER up 6.70% and TATAMOTOR up 5.70%. Top losers were POWERGRID down 1.16% and ACC down 1.10%. Most sectors closed positively, led by BANKEX up 2.55%. The market may face resistance around 16757/5030 but further rally is possible to 16843-17000/5050-5090 if it trades above these levels. Support is seen at 16507-16450/4952-4938. SUNPHARMA and JAIN IRRIGATION are suggested as stocks with positive
The key points from the market summary document are:
1. Indian stock indices Sensex and Nifty closed at higher levels of 17936 and 5368 respectively, gaining over 1% for the day.
2. Top gainers during the day were HEROHONDA, RELINFRA and BHARTIARTL while top losers were IDEA, GRASIM and TCS.
3. Realty, Oil & Gas and Auto sectors saw gains while Banking sector rose nearly 2%. The trading session is likely to see positive momentum continue if indices remain above key support levels.
The document provides a technical market summary for 01/09/2010. It summarizes the performance of key indices and sectors for the day. Nifty and Sensex opened lower but recovered losses to close marginally lower. Top gainers included M&M, Ambuja Cements, and ITC, while top losers were JP Associates, RCom, and Reliance. The document also lists pivot levels for various stocks and provides a short-term outlook suggesting the market may test resistance levels if indices trade above certain thresholds the next day.
The summary provides an overview of the key information from the technical report on the stock market:
- The indices (Nifty and Sensex) closed lower by 0.62% and 0.64% respectively. Powergrid, PNB, and ITC were among the top gainers while Suzlon, Cairn, and Cipla were the top losers.
- The report expects the indices to find support around 5380-5385 levels and sees resistance at 5480. The bullish view will only be negated if Nifty closes below 5340.
- Pivot levels are provided for various stocks to indicate support and resistance levels.
- Bajaj Hind and IDB
The document provides a market summary for the day, including:
- Index levels for Nifty and Sensex along with their opening, high, low and closing levels and percentage change
- Top 5 gainers and losers for the day along with their percentage change
- Sectoral performance for the day with percentage gain/loss for key sectors
- Analysis that markets are currently trading near the upper limit of their range and are likely to test higher levels if they close above certain index levels. Key support levels are also mentioned.
- Stocks with positive and negative bias for the next 2-3 days.
- Pivot point levels for various stocks.
The technical report provides a summary of the Indian stock market indices and sector performances on September 13, 2010. It notes that the Nifty closed at 5640 and Sensex closed at 18800, up 0.57% and 0.71% respectively. Top gainers included M&M, HDFCBank, and SBIN, while top losers were POWERGRID, TATAMOTORS, and RELINFRA. The banking sector had gains of 2.19% while oil and gas saw losses of 0.27%. For the coming week, the report expects the indices to test resistance levels of 18900-19050 and 5700-5750. Key support levels are identified as 18440-18321 and
The document provides a summary of the Indian stock market indices and sector performances on 15/09/2010. It notes that the key indices, Sensex and Nifty, opened positively and reached new 52-week highs before closing up slightly. The top gainers were led by Kotak Bank, Wipro, and JPAssociat, while the top losers were Hindalco, ACC, and SBIN. Most sectors closed up except for metals. The report identifies potential support and resistance levels and lists stocks that may trend positively or negatively over the next 2-3 days. Pivot point values are also provided for various stocks.
The document provides a market summary for July 22, 2010. It summarizes that the key indices closed positively but ranged between support and resistance levels. The top gainers and losers among stocks are listed. Sectoral performances are also summarized, with metals and realty performing best. The document analyzes support and resistance levels for the indices and provides potential pivot levels for various stocks to watch. It identifies some specific stocks with positive and negative bias. In summary, the document analyzes the day's market activity and provides technical indicators for the short-term market outlook and trading opportunities.
The document provides a market summary for May 21, 2010 including:
1) Key indices like Nifty and Sensex opened lower but closed slightly higher despite losses in sectors like realty and auto.
2) Top gainers were led by ONGC and top losers by JP Associates. Oil & gas and PSU sectors saw gains while realty saw losses.
3) The analyst maintains a bearish outlook and recommends shorting the market on any bounce between defined resistance levels, with stop losses at 5020.
The document provides a technical market summary for August 23, 2010 including indices levels, top gainers and losers, sectoral performance, and a technical analysis. It notes that upside momentum is likely to continue based on weekly charts, and advises going long on declines between 5470-5400 levels with a stop loss of 5340 for a target of 5700-5750. Key support and resistance levels are also provided for various stocks.
The market summary provides an overview of the performance of key indices and sectors in the Indian market on 06/07/2010. The Nifty and Sensex opened marginally lower and closed slightly down. Top gainers were led by PNB, while RCOM and Maruti were among the top losers. The oil & gas and metal sectors saw declines, while healthcare and IT saw gains. The document also lists pivot levels for various stocks and provides a technical analysis indicating the market may see further testing of support levels.
The market indices opened gap down and fell further due to selling pressure, closing deep in the red below key support levels. Metals and realty sectors saw the highest losses of over 4%. Top gainers were Hero Honda and Tata Power, while top losers were Idea, Tata Motors, and RelCapital. Technical indicators suggest the indices may test lower support levels in the coming sessions. Stocks like JSW Steel and Yes Bank are recommended as short selling opportunities.
The market summary provides an overview of the performance of key indices and sectors in the Indian market on 11/05/2010. The Nifty and Sensex closed higher by 3.5% and 3.35% respectively. The top gainers were RELINFRA, UNITECH and TATASTEEL, while the top losers were CIPLA, BPCL and CIPLA. The realty and metal sectors saw the highest gains. The market opened with a gap up on strong global cues and rallied through the day to close near the high point. The summary also provides key support and resistance levels for indices and stocks.
The market indices opened positively on news of the RBI monetary policy announcement. Key banking stocks saw strong buying and volume. Technical indicators signal further upside potential for the market, with support at 5180-5160. On the downside, sectors like IT saw losses while realty, banking and PSU saw gains. Overall the market closed slightly higher.
The document provides a summary of the Indian stock market indices and sector performances on 07/09/2010. It notes that both the Nifty and Sensex opened with an upside gap and reached new 52-week highs, led by gains in Reliance Industries, metal and banking stocks. The top gainers were TATASTEEL, HINDALCO, and STER, while the top losers were HEROHONDA, BPCL, and HINDUNILVR. The metal, banking, and oil & gas sectors saw gains over 1%, while IT saw gains of 1.88%. Pivot levels and positive/negative biased stocks are also listed.
The daily technical report provided the following key information:
1) Domestic indices opened higher but traded in a narrow range and closed with marginal gains.
2) The report analyzed technical charts and noted indecisiveness at current levels, identifying resistance and support levels to watch.
3) Top gainers and losers were listed along with sectoral performances and positive and negative bias stocks for the next 2-3 days.
4) Pivot price levels were provided for various stocks to watch potential support and resistance levels.
The document provides a technical market summary for the Indian stock market. It summarizes the performance of key indices like Nifty and Sensex, lists the top gainers and losers during the day, and analyzes sector performances. It predicts that the indices are likely to rise further in the coming weeks if they close above certain support levels. It also lists pivot point levels for various stocks and recommends some stocks with positive and negative bias for the next 2-3 days.
The Indian markets are expected to open higher, tracking gains in most Asian markets. Spain has asked for a bailout of up to €100 billion for its banking system. Chinese exports grew more than expected in May. In India, shares extended gains for a fifth session despite weak global cues as major central banks held off on additional stimulus. The key support and resistance levels for the Nifty are 5,023 and 5,114 respectively. L&T has bagged orders worth Rs. 483 crore to build commercial vessels in Qatar. Vedanta Resources has acquired a 24.5% stake in Raykal Aluminium for Rs. 201 crore.
Axis Bank reported a 27.0% year-over-year increase in net profit to Rs. 942 crore for the first quarter of fiscal year 2012, in line with analyst estimates. Business growth momentum slowed as advances declined 7.4% quarter-over-quarter and deposits fell 3.0% quarter-over-quarter, moderating the bank's cash-deposit ratio to 40.5% from 41.1% last quarter. However, asset quality remained healthy with slippage ratio declining to 0.8% and gross and net NPA ratios stable.
1) For 1QFY2012, Electrosteel Castings reported 16.4% sales growth but margins declined due to higher raw material costs. EBITDA fell 18.2% and net profit declined 7.2%.
2) While sales volumes grew, costs increased more due to a rise in raw material costs as a percentage of sales.
3) The company maintains a buy recommendation due to initiatives in steelmaking and backward integration that should lower costs starting in FY2013 and valuation remains attractive.
1) For 1QFY2012, Persistent Systems reported revenues of ₹224 crore, up 5.2% over the previous quarter and 23.6% over the same period last year.
2) EBITDA was ₹40 crore, up 5.3% over the previous quarter but margins declined.
3) PAT was ₹28 crore, down 16.8% over the previous quarter due to higher taxes.
4) Management maintained revenue guidance of 29% growth for FY2012 and expects PAT to remain flat despite higher tax rates.
HT Media reported a 22.7% year-over-year increase in revenue to ₹494 crore for the first quarter of FY2012. Revenue was also up 5.8% quarter-over-quarter. Advertising revenue grew 17% year-over-year, with 18% growth in English and 15% growth in Hindi. Operating profit rose 11.8% year-over-year to ₹87.8 crore due to higher other income and lower tax rates, although operating margins contracted by 174 basis points. The company maintained its Accumulate rating based on expectations of continued revenue growth and margin expansion.
The summary is:
1) The derivative report analyzes the performance of the Nifty futures, options, and key stocks from the previous trading session on July 18, 2011.
2) It provides details on changes in open interest, premium levels, volatility, and turnover for various derivatives contracts.
3) Trading strategies and technical analysis is also given for some stocks along with risk-reward profiles of sample spreads trades for the Nifty.
The market ended lower, with the Sensex and Nifty closing down 0.3%. Mid- and small-cap indices closed higher. Select heavyweights like Hindalco Industries and BHEL gained 1-3%, while TCS and Tata Motors lost 1-2%. In corporate news, Motherson Sumi Systems agreed to acquire an 80% stake in Peguform for €141.5 million. HDFC Bank, Cadila Healthcare, Crompton Greaves, and Ashok Leyland are scheduled to announce their quarterly results. The trend for the day will be decided by whether Nifty trades above or below the levels of 18,533/5,572 in early trade.
- GSM subscriber additions in India continued their declining trend in June 2011, with net additions of 9.6 million, down 10% from the previous month.
- All major operators except BSNL reported a drop in subscriber additions. Bharti and Vodafone each added 2.1 million subscribers.
- The total GSM subscriber base reached 598.8 million in June 2011, with Bharti, Vodafone, Idea and BSNL maintaining their major market shares.
The document provides a technical analysis of the Indian stock market indices Sensex and Nifty for the week of July 16, 2011. It summarizes that the indices declined over 1.5% for the week and are currently trading in a range between 18,326/5496 on the downside and 19,132/5740 on the upside. It notes that a break above or below this range would dictate the direction of the upcoming trend. The analysis also lists pivot levels for 50 Nifty stocks to watch in the coming week.
The document provides a summary of derivative market activity in India for July 18, 2011. Key points include:
- Nifty futures open interest increased 0.67% while Mini Nifty increased 3.48% as the market closed at 5581.10
- Nifty July futures closed at a premium of 5.85 points and August futures at a premium of 22.60 points
- Implied volatility of at-the-money options decreased from 18% to 17.3%
- Total open interest in the market was Rs. 135,158 crore with stock futures open interest at Rs. 34,675 crore.
The indices opened flat but traded choppily throughout the day. Metal, auto and realty stocks declined while IT stocks gained. The indices are currently trading in a range between 18,326-18,810/5496-5653 on the downside and 19,132-19,094/5740-5700 on the upside. A break above these resistance levels could lead to further gains while a break below support could result in losses extending to 17,805-17,950/5350-5400. Pivot levels for 50 Nifty stocks are provided.
- The key Indian stock indices declined slightly, with the Sensex and Nifty closing down 0.3%.
- GSM subscriber additions in India continued their declining trend in June across most major operators such as Idea, Bharti Airtel, and Vodafone. Total GSM subscriber addition was 9.6 million, down 10% from the previous month.
- Tata Motors reported flat annual global sales growth in June 2011 compared to the previous year.
- South Indian Bank reported a 41.2% year-over-year increase in net profit to Rs. 82 crores for the first quarter of fiscal year 2012, slightly below analyst estimates.
- Business growth remained strong, with advances growth of 31.2% and deposits growth of 35.5% year-over-year. However, net interest margins compressed by 29 basis points sequentially to 2.8% due to a sharp rise in the bank's cost of deposits.
- Non-interest income was boosted by treasury gains, but fee income growth was modest. Asset quality was stable with gross and net NPAs rising marginally, and provision coverage at a comfortable 73.1%.
Bajaj Auto reported marginally lower-than-expected results for the first quarter of fiscal year 2012, with net sales growth of 22.8% year-over-year driven by a 17.7% increase in volumes. However, operating margins contracted by 145 basis points quarter-over-quarter to 19.1% due to a 150 basis point increase in raw material costs. As a result, net profit grew by 20.5% year-over-year to ₹711 crore, which was slightly below analyst estimates. Going forward, the analyst expects further margin pressure and has revised downward its earnings estimates for fiscal years 2012 and 2013 to factor in higher raw material costs and changes to export incentives.
1) Tata Consultancy Services (TCS) reported strong results for the first quarter of fiscal year 2012, outperforming expectations with revenue growth of 6.3% over the previous quarter and 31.4% over the same quarter of the previous fiscal year.
2) A key highlight was 7.4% quarter-over-quarter growth in business volumes. While profit margins declined due to wage hikes, net profit remained flat due to foreign exchange gains.
3) Management maintained a positive outlook, highlighting strong demand environment and deal pipeline, and expects pricing increases later in the fiscal year.
The document summarizes the Indian stock market outlook and performance on July 15, 2011. It reports that domestic indices closed with modest gains of 0.1-0.4%, while global indices declined. Wholesale price inflation in India rose to 9.44% in June 2011, above estimates and persisting above 9% for seven months, driven by increases in primary articles and fuel costs. Key benchmark levels are identified for determining if the market may continue rallying or correct in the near term.
The summary is:
1) The derivative report analyzes the movement in Nifty futures, options, and individual stocks between July 14-15, 2011.
2) Nifty futures open interest decreased while mini Nifty open interest increased as the market closed at 5599.80.
3) Implied volatility of at-the-money options increased from 17.6% to 18%.
The Sensex and Nifty indices opened lower and traded with volatility, closing marginally lower. On the sectoral front, Realty, Banks and Healthcare gained while IT and FMCG fell. The advance-decline ratio favored advancing stocks. On the daily chart, prices tested but did not close above the downward gap area of 18,679-18,589/5,601-5,580 levels. Immediate resistance is seen at 18,735/5,633, while 18,449/5,541 is crucial support.
1) Infosys reported modest revenue growth of 3.2% qoq for 1QFY2012. EBITDA and margins declined due to wage hikes.
2) Guidance for 2QFY2012 revenue growth was lower than expected at 3.5-5% qoq. Annual revenue growth guidance was unchanged.
3) The analyst revised EPS estimates down and cut the target price to INR 3,200 due to macro concerns and muted guidance.
This document summarizes a derivative report from India Research dated July 13, 2011. Some key points:
- The Nifty futures open interest increased 0.51% while Minifty futures open interest rose 8.2% as the market closed at 5526.15.
- Implied volatility of at-the-money options increased from 18% to 19.75%. PCR-OI decreased from 1.20 to 1.15.
- Total open interest of the market is Rs. 125,816 crore and stock futures open interest is Rs. 33,500 crore.
- FII were net sellers of Rs. 969 crore in the cash market segment. Put-call
Easily Verify Compliance and Security with Binance KYCAny kyc Account
Use our simple KYC verification guide to make sure your Binance account is safe and compliant. Discover the fundamentals, appreciate the significance of KYC, and trade on one of the biggest cryptocurrency exchanges with confidence.
Storytelling is an incredibly valuable tool to share data and information. To get the most impact from stories there are a number of key ingredients. These are based on science and human nature. Using these elements in a story you can deliver information impactfully, ensure action and drive change.
How to Implement a Strategy: Transform Your Strategy with BSC Designer's Comp...Aleksey Savkin
The Strategy Implementation System offers a structured approach to translating stakeholder needs into actionable strategies using high-level and low-level scorecards. It involves stakeholder analysis, strategy decomposition, adoption of strategic frameworks like Balanced Scorecard or OKR, and alignment of goals, initiatives, and KPIs.
Key Components:
- Stakeholder Analysis
- Strategy Decomposition
- Adoption of Business Frameworks
- Goal Setting
- Initiatives and Action Plans
- KPIs and Performance Metrics
- Learning and Adaptation
- Alignment and Cascading of Scorecards
Benefits:
- Systematic strategy formulation and execution.
- Framework flexibility and automation.
- Enhanced alignment and strategic focus across the organization.
At Techbox Square, in Singapore, we're not just creative web designers and developers, we're the driving force behind your brand identity. Contact us today.
Understanding User Needs and Satisfying ThemAggregage
https://www.productmanagementtoday.com/frs/26903918/understanding-user-needs-and-satisfying-them
We know we want to create products which our customers find to be valuable. Whether we label it as customer-centric or product-led depends on how long we've been doing product management. There are three challenges we face when doing this. The obvious challenge is figuring out what our users need; the non-obvious challenges are in creating a shared understanding of those needs and in sensing if what we're doing is meeting those needs.
In this webinar, we won't focus on the research methods for discovering user-needs. We will focus on synthesis of the needs we discover, communication and alignment tools, and how we operationalize addressing those needs.
Industry expert Scott Sehlhorst will:
• Introduce a taxonomy for user goals with real world examples
• Present the Onion Diagram, a tool for contextualizing task-level goals
• Illustrate how customer journey maps capture activity-level and task-level goals
• Demonstrate the best approach to selection and prioritization of user-goals to address
• Highlight the crucial benchmarks, observable changes, in ensuring fulfillment of customer needs
[To download this presentation, visit:
https://www.oeconsulting.com.sg/training-presentations]
This PowerPoint compilation offers a comprehensive overview of 20 leading innovation management frameworks and methodologies, selected for their broad applicability across various industries and organizational contexts. These frameworks are valuable resources for a wide range of users, including business professionals, educators, and consultants.
Each framework is presented with visually engaging diagrams and templates, ensuring the content is both informative and appealing. While this compilation is thorough, please note that the slides are intended as supplementary resources and may not be sufficient for standalone instructional purposes.
This compilation is ideal for anyone looking to enhance their understanding of innovation management and drive meaningful change within their organization. Whether you aim to improve product development processes, enhance customer experiences, or drive digital transformation, these frameworks offer valuable insights and tools to help you achieve your goals.
INCLUDED FRAMEWORKS/MODELS:
1. Stanford’s Design Thinking
2. IDEO’s Human-Centered Design
3. Strategyzer’s Business Model Innovation
4. Lean Startup Methodology
5. Agile Innovation Framework
6. Doblin’s Ten Types of Innovation
7. McKinsey’s Three Horizons of Growth
8. Customer Journey Map
9. Christensen’s Disruptive Innovation Theory
10. Blue Ocean Strategy
11. Strategyn’s Jobs-To-Be-Done (JTBD) Framework with Job Map
12. Design Sprint Framework
13. The Double Diamond
14. Lean Six Sigma DMAIC
15. TRIZ Problem-Solving Framework
16. Edward de Bono’s Six Thinking Hats
17. Stage-Gate Model
18. Toyota’s Six Steps of Kaizen
19. Microsoft’s Digital Transformation Framework
20. Design for Six Sigma (DFSS)
To download this presentation, visit:
https://www.oeconsulting.com.sg/training-presentations
Zodiac Signs and Food Preferences_ What Your Sign Says About Your Tastemy Pandit
Know what your zodiac sign says about your taste in food! Explore how the 12 zodiac signs influence your culinary preferences with insights from MyPandit. Dive into astrology and flavors!
IMPACT Silver is a pure silver zinc producer with over $260 million in revenue since 2008 and a large 100% owned 210km Mexico land package - 2024 catalysts includes new 14% grade zinc Plomosas mine and 20,000m of fully funded exploration drilling.
Taurus Zodiac Sign: Unveiling the Traits, Dates, and Horoscope Insights of th...my Pandit
Dive into the steadfast world of the Taurus Zodiac Sign. Discover the grounded, stable, and logical nature of Taurus individuals, and explore their key personality traits, important dates, and horoscope insights. Learn how the determination and patience of the Taurus sign make them the rock-steady achievers and anchors of the zodiac.
At Techbox Square, in Singapore, we're not just creative web designers and developers, we're the driving force behind your brand identity. Contact us today.
[To download this presentation, visit:
https://www.oeconsulting.com.sg/training-presentations]
This presentation is a curated compilation of PowerPoint diagrams and templates designed to illustrate 20 different digital transformation frameworks and models. These frameworks are based on recent industry trends and best practices, ensuring that the content remains relevant and up-to-date.
Key highlights include Microsoft's Digital Transformation Framework, which focuses on driving innovation and efficiency, and McKinsey's Ten Guiding Principles, which provide strategic insights for successful digital transformation. Additionally, Forrester's framework emphasizes enhancing customer experiences and modernizing IT infrastructure, while IDC's MaturityScape helps assess and develop organizational digital maturity. MIT's framework explores cutting-edge strategies for achieving digital success.
These materials are perfect for enhancing your business or classroom presentations, offering visual aids to supplement your insights. Please note that while comprehensive, these slides are intended as supplementary resources and may not be complete for standalone instructional purposes.
Frameworks/Models included:
Microsoft’s Digital Transformation Framework
McKinsey’s Ten Guiding Principles of Digital Transformation
Forrester’s Digital Transformation Framework
IDC’s Digital Transformation MaturityScape
MIT’s Digital Transformation Framework
Gartner’s Digital Transformation Framework
Accenture’s Digital Strategy & Enterprise Frameworks
Deloitte’s Digital Industrial Transformation Framework
Capgemini’s Digital Transformation Framework
PwC’s Digital Transformation Framework
Cisco’s Digital Transformation Framework
Cognizant’s Digital Transformation Framework
DXC Technology’s Digital Transformation Framework
The BCG Strategy Palette
McKinsey’s Digital Transformation Framework
Digital Transformation Compass
Four Levels of Digital Maturity
Design Thinking Framework
Business Model Canvas
Customer Journey Map
Event Report - SAP Sapphire 2024 Orlando - lots of innovation and old challengesHolger Mueller
Holger Mueller of Constellation Research shares his key takeaways from SAP's Sapphire confernece, held in Orlando, June 3rd till 5th 2024, in the Orange Convention Center.
Top mailing list providers in the USA.pptxJeremyPeirce1
Discover the top mailing list providers in the USA, offering targeted lists, segmentation, and analytics to optimize your marketing campaigns and drive engagement.
SATTA MATKA SATTA FAST RESULT KALYAN TOP MATKA RESULT KALYAN SATTA MATKA FAST RESULT MILAN RATAN RAJDHANI MAIN BAZAR MATKA FAST TIPS RESULT MATKA CHART JODI CHART PANEL CHART FREE FIX GAME SATTAMATKA ! MATKA MOBI SATTA 143 spboss.in TOP NO1 RESULT FULL RATE MATKA ONLINE GAME PLAY BY APP SPBOSS
Best practices for project execution and deliveryCLIVE MINCHIN
A select set of project management best practices to keep your project on-track, on-cost and aligned to scope. Many firms have don't have the necessary skills, diligence, methods and oversight of their projects; this leads to slippage, higher costs and longer timeframes. Often firms have a history of projects that simply failed to move the needle. These best practices will help your firm avoid these pitfalls but they require fortitude to apply.
1. Date : 11/06/2010
Market Summary
Indices Top 5 Gainers Top 5 Losers Sectoral Watch
Nifty Sensex Stocks % Gain Stocks % Loss Sector %G/L
Open 5000 16669 RELINFRA 5.58 POWERGRID 0.63 AUTO 2.98
High 5085 16943 HEROHONDA 4.66 PNB 0.17 METAL 2.12
Low 4998 16669 TATAMOTOR 4.65 REALTY 1.80
Close 5079 16922 BHARTIARTL 4.65 TECK 1.76
% Chg 1.57 1.59 HINDALCO 4.55 HC 1.63
Source : Falcon NIFTY DLY CHART
Markets opened on a positive note, traded in a narrow range and finally picked up momentum on the upside in
the later half of the session to close near days high. In coming trading session if indices trade convincingly above
16943 / 5085 levels then it may test 17050 – 17120 / 5120 – 5140 levels. On the downside 16808 – 16767 / 5043
– 5031 levels may act support for the day.
Stocks +ve Bias Stocks -ve Bias
HINDALCO
TATA STEEL
The stocks mentioned above are given considering the general direction of the trend expected over a period of 2 or
3 days. Investors / Traders are expected to use their own discretion while taking any action related to the stock.
For Private Circulation Only.
2. HDFC BANK
View: BULLISH Buy Range : Rs. 1916.00 - 1905.00 Closing Price: Rs.1916.00
*Stop Loss: Rs.1885.00 *Target: Rs.1975.00 R:R. 1 : 2.5
The stock has given a Triangular
breakout with rising volumes.
Further, the momentum oscillator
v.i.z. Stochastic and RSI are
positively poised .This suggests
upside .We recommend to buy
the stock in the range of Rs.
1916.00 - 1905.00 with a stop
loss of 1885.00 for a target
ofRs.1975.00
in coming 6- 8 days
* Stop Losses, Targets and Time Frame are indicative and readers should use their discretion in following the same.
Stop Losses / Trailed Stop Losses should be strictly implemented in order to protect profits / reduce losses. Non
adherence to the same can lead to bigger losses at times.
For Private Circulation Only.
4. RESEARCH TEAM
Shardul Kulkarni Head - Technicals
Brijesh Ail Technical Analyst
Mileen Vasudeo Technical Analyst
For any Queries, Suggestions and Feedback kindly mail to vasudeo.kamalakant@angeltrade.com
Research Team: 022-3952 6600 Website: www.angelbroking.com
DISCLAIMER: This document is not for public distribution and has been furnished to you solely for your information and must not be reproduced or
redistributed to any other person. Persons into whose possession this document may come are required to observe these restrictions.
Opinion expressed is our current opinion as of the date appearing on this material only. While we endeavor to update on a reasonable basis the
information discussed in this material, there may be regulatory, compliance, or other reasons that prevent us from doing so. Prospective investors and
others are cautioned that any forward-looking statements are not predictions and may be subject to change without notice. Our proprietary trading and
investment businesses may make investment decisions that are inconsistent with the recommendations expressed herein.
The information in this document has been printed on the basis of publicly available information, internal data and other reliable sources believed to be
true and are for general guidance only. While every effort is made to ensure the accuracy and completeness of information contained, the company
takes no guarantee and assumes no liability for any errors or omissions of the information. No one can use the information as the basis for any claim,
demand or cause of action.
Recipients of this material should rely on their own investigations and take their own professional advice. Each recipient of this document should make
such investigations as it deems necessary to arrive at an independent evaluation of an investment in the securities of companies referred to in this
document (including the merits and risks involved), and should consult their own advisors to determine the merits and risks of such an investment. Price
and value of the investments referred to in this material may go up or down. Past performance is not a guide for future performance. Certain
transactions - futures, options and other derivatives as well as non-investment grade securities - involve substantial risks and are not suitable for all
investors. Reports based on technical analysis centers on studying charts of a stock's price movement and trading volume, as opposed to focusing on a
company's fundamentals and as such, may not match with a report on a company's fundamentals.
We do not undertake to advise you as to any change of our views expressed in this document. While we would endeavor to update the information
herein on a reasonable basis, Angel Broking, its subsidiaries and associated companies, their directors and employees are under no obligation to
update or keep the information current. Also there may be regulatory, compliance, or other reasons that may prevent Angel Broking and affiliates from
doing so. Prospective investors and others are cautioned that any forward-looking statements are not predictions and may be subject to change without
notice.
Angel Broking Limited and affiliates, including the analyst who has issued this report, may, on the date of this report, and from time to time, have long or
short positions in, and buy or sell the securities of the companies mentioned herein or engage in any other transaction involving such securities and earn
brokerage or compensation or act as advisor or have other potential conflict of interest with respect to company/ies mentioned herein or inconsistent
with any recommendation and related information and opinions.
Angel Broking Limited and affiliates may seek to provide or have engaged in providing corporate finance, investment banking or other advisory services
in a merger or specific transaction to the companies referred to in this report, as on the date of this report or in the past.
Sebi Registration No : INB 010996539
For Private Circulation Only.